Bay Hive — Pollinator Intelligence Toolkit
Bay Hive started as a one-afternoon experiment: plot iNaturalist pollinator sightings on the same map as the Monarch Waystations and Green Bay's Pollinator Corridor locations. The gap between the two was immediately interesting — sightings clustering near certified habitat in some places, surprising absences in others. That was enough to keep going.
Then came the Homegrown National Parks data. Then the USGS Protected Areas Database. Then Wisconsin DNR's State Natural Areas. Each public dataset opened another angle on the same question: where is the pollinator habitat, and where does it need to grow? The map kept getting more useful, so I kept building.
I volunteer weeding and maintaining the pollinator planting at NWTC (Northeast Wisconsin Technical College), and I keep my own pollinator habitat in my front yard. Both gave me a stake in understanding the larger picture — not just what's happening in a single yard or a single campus planting, but across the whole Green Bay area. This tool didn't exist before. I thought it should.
What it does
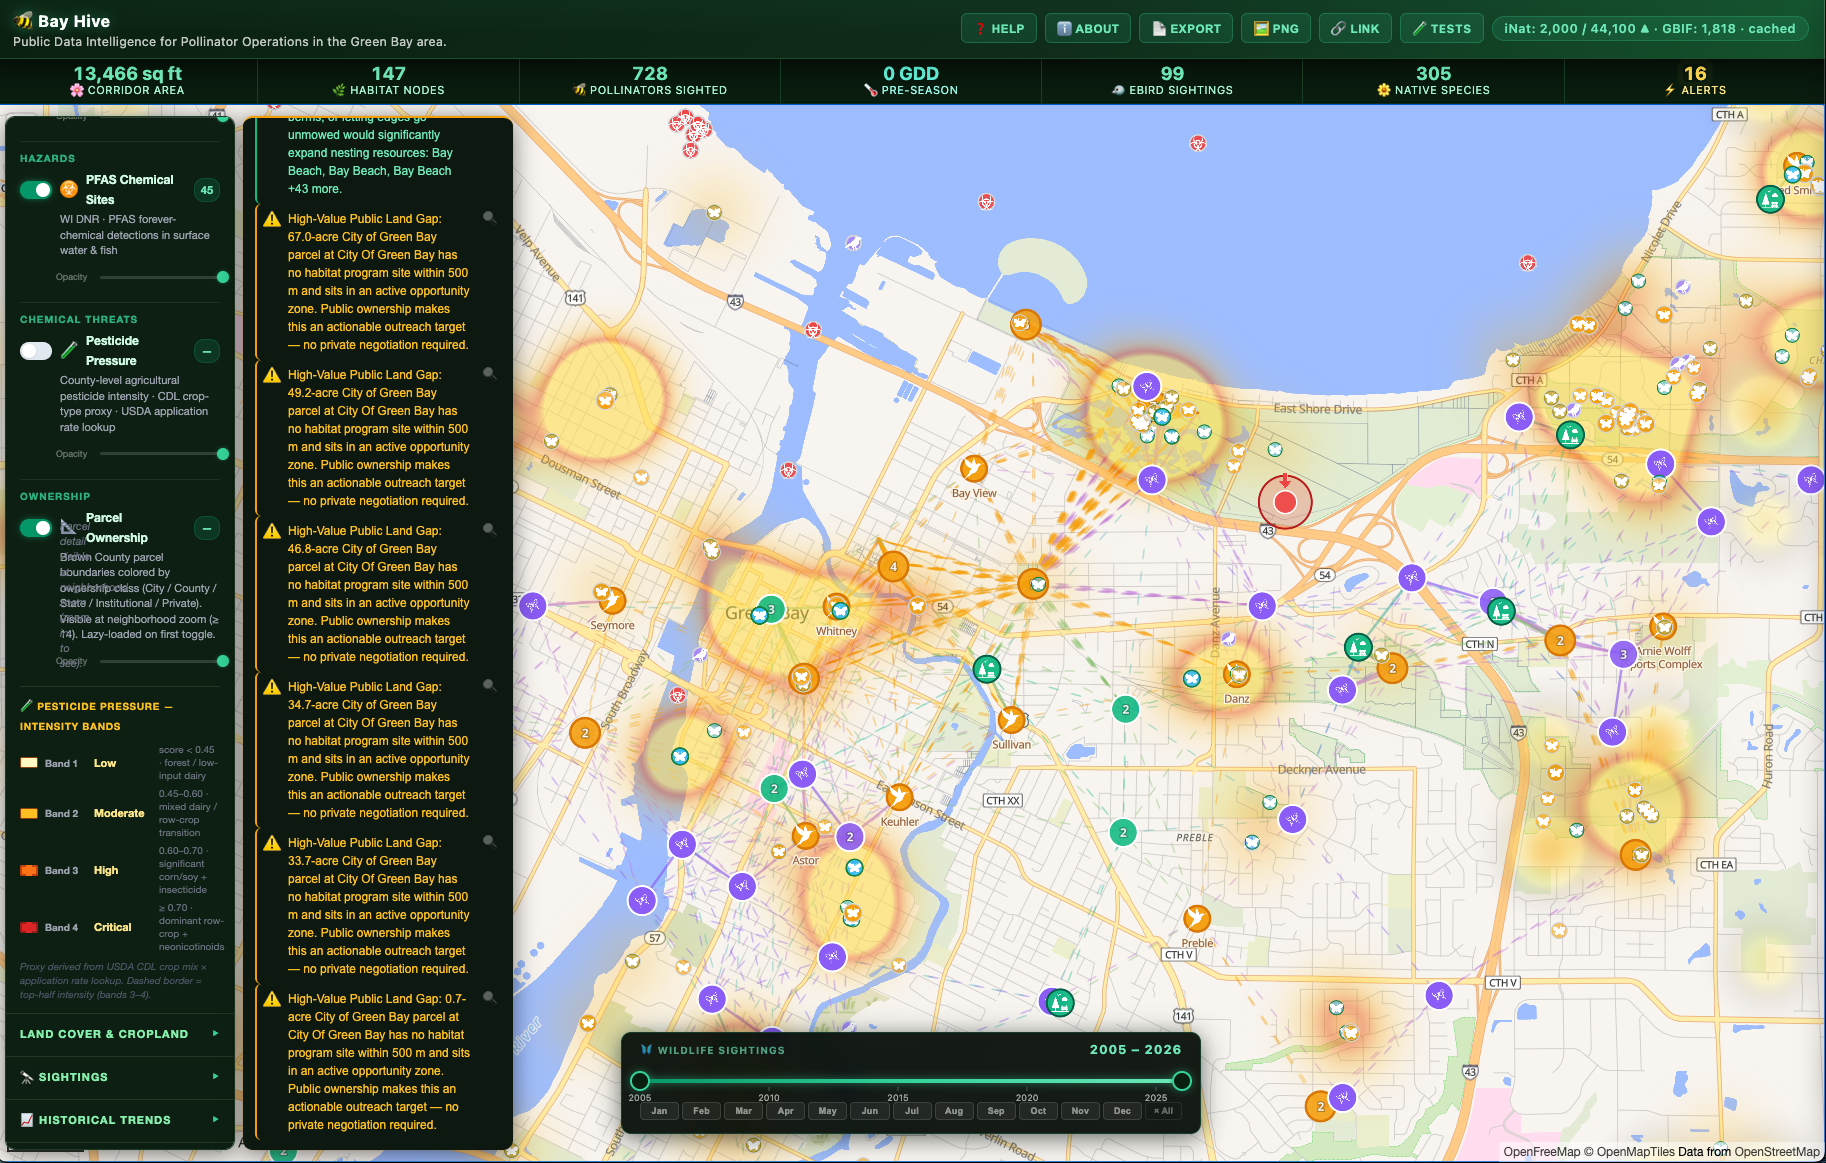
Bay Hive is a layered geospatial dashboard centered on a 15 km radius around Green Bay, WI. The interface is built around an activity bar with slide-out panels — icon strip opens labeled content panes for Habitat Sites, Sightings, Analysis, Conservation & Hazards, Landcover & Cropland, Legend, Trends, and Alerts. It aggregates fifteen public datasets into a single interactive map and runs a client-side intelligence engine over the combined data.
Data sources:
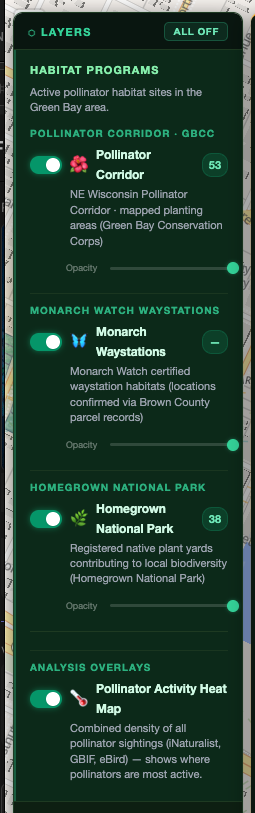
- NE WI Pollinator Corridor — the formal planting sites managed by the Green Bay Conservation Corps: public parks, rights-of-way, institutional properties
- GBCC Habitat Treatments — restoration treatment polygons showing active invasive removal, prescribed burns, and re-planting work
- Monarch Watch Certified Waystations — 56 verified waystation habitats in the area, cross-referenced with Brown County parcel records
- Homegrown National Park — self-reported native plant yards from Doug Tallamy's HNP initiative
- iNaturalist — up to 2,000 observations per query: Pollinators, Native Plants, Other Plants, Other Wildlife. Native/invasive status resolved against Wisconsin's regional checklist
- GBIF — museum specimens, herbarium records, and multi-source research datasets for historical depth
- FWS Bee Distribution — all six bee families from the U.S. Fish & Wildlife Service dataset via GBIF; powers a species richness heatmap and an imperiled species layer (NatureServe G1–G3, IUCN VU+)
- eBird — bird sighting records from Cornell Lab's API (optional API key)
- Wikimedia Commons — geotagged photos surfaced by keyword and proximity filter
- Journey North — historical migration observation data
- USGS PAD-US v3.0 — the national protected areas inventory: federal, state, local, tribal, NGO lands
- WI DNR State Natural Areas — preserved sites protecting outstanding examples of Wisconsin's natural communities
- WI DNR Managed Lands — additional DNR-managed conservation parcels
- WI DNR Urban Tree Canopy — 1 m NAIP-derived canopy coverage for three survey years (2013, 2020, 2022), timeline-linked to the date scrubber
- WI DNR PFAS Contamination Sites — "forever chemical" detection in surface water and fish tissue; any PFAS site within 1 km of habitat triggers an alert
- NLCD 2021 — 30-meter resolution national land cover at 16 classes, served tile-by-tile through a custom pixel-filter proxy
- USDA CDL 2023 — full-color crop-type raster; used to compute the Pollinator Mismatch alert
- USDA NASS QuickStats — county-level honey bee colony counts and crop acreage when an API key is configured
- NOAA CDO / NCEI — climate normals and weather data (optional API key)
Analysis overlays
Several computed layers supplement the raw data:
- 🐝 Bee-Crop Field Fringe — amber heatmap of NLCD agricultural pixels (Cultivated Crops + Pasture/Hay) near the corridor. Shows where cultivated fields border the habitat network and where pollination demand is highest.
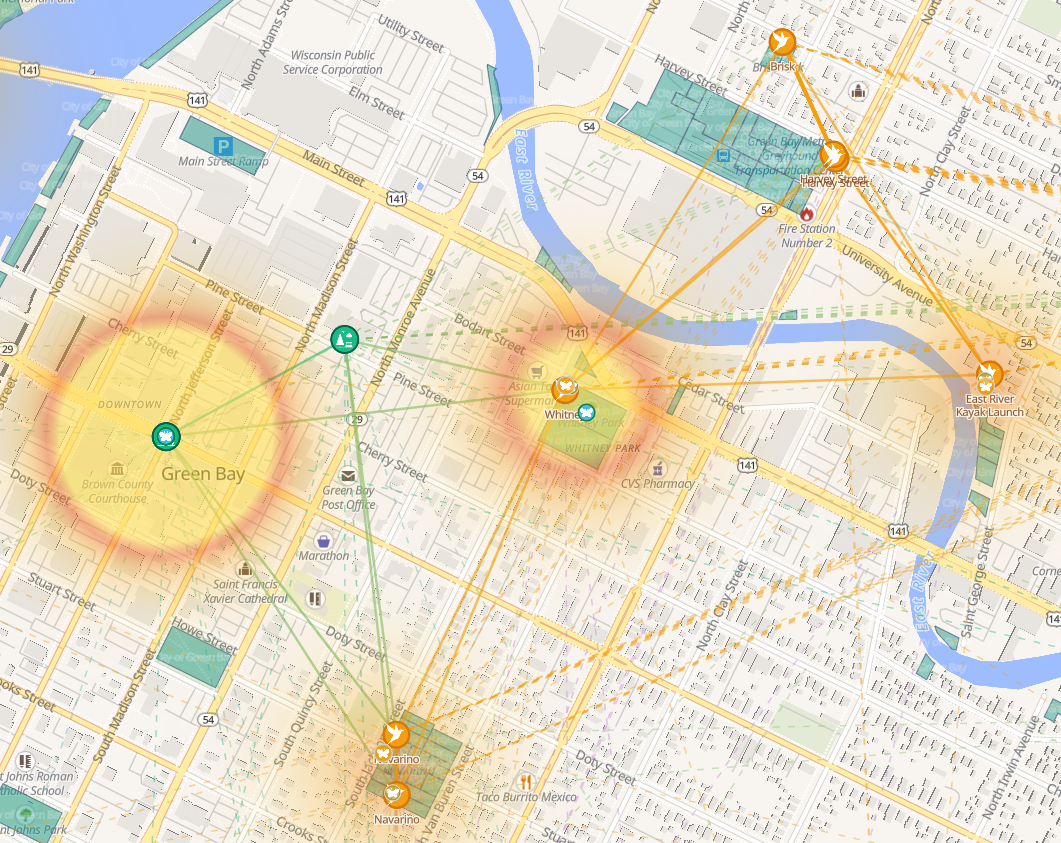
- 🌡 Pollinator Activity Traffic — composite density heatmap combining corridor sites, waystations, and HNP yards. Shows where pollinator access is densest across the region.
- 🧪 Pesticide Pressure — county-level choropleth (pale yellow → deep red) showing agricultural pesticide application intensity for the 9 counties in the analysis region. Derived from crop mix and known neonicotinoid seed treatment use patterns.
- 🪨 Nesting Habitat Badges — 0–100 nesting suitability scores on each corridor site marker, computed from NLCD class 31 (Barren), 52 (Shrub/Scrub), and 71 (Grassland/Herbaceous) pixels within 300 m.
- 🌳 Urban Tree Canopy — WI DNR canopy coverage raster for three survey years, viewable individually or stepped through the timeline scrubber to compare change across 2013, 2020, and 2022.
- 🐝 Bee Species Richness — heatmap of bee family diversity derived from the FWS distribution dataset. An imperiled species sub-layer highlights areas with NatureServe G1–G3 or IUCN VU+ ranked bee records.
Intelligence alerts
The alerts engine runs entirely client-side against data already in memory and recalculates every time new data loads. Fourteen alert types, each backed by a specific spatial method:
| Alert | Method |
|---|---|
| PFAS Near Habitat | Haversine distance, 1 km radius from each PFAS site to all corridor sites and waystations |
| Unsupported Sites | Any habitat site with no pollinator sighting within 500 m |
| Opportunity Zones | Grid-bucket sightings at ~1 km resolution; flags ≥5 sightings with no habitat within 800 m |
| Declining Public Zone | Opportunity zone with a declining sighting trend ⬇️ and publicly owned land nearby |
| Public Land Gap | City/County parcel ≥0.5 ac within an opportunity zone and no habitat within 500 m |
| Connected Pairs | Habitat site pairs within 300 m of each other (MST stepping-stone distance) |
| Isolated Habitat | Sites with no other habitat within 2 km (islands beyond reach of the broader network) |
| Weak Nodes | Corridor sites whose nearest neighbour is 700 m–2 km away |
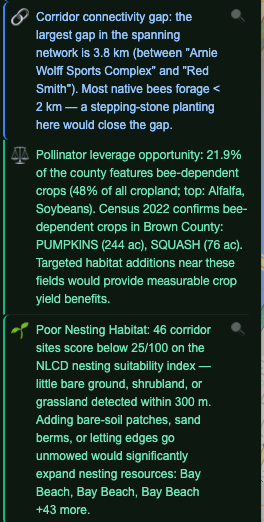
| Connectivity Gap | Widest MST edge among corridor sites; flags if >2.5 km (exceeds most native bee foraging range) |
| Quadrant Coverage | Divides the map into four quadrants; flags any with no habitat present |
| Pollinator Mismatch | Compares bee-dependent crop acreage % against estimated habitat coverage from site count |
| High Pesticide Pressure | Flags corridor sites and waystations in Critical-band counties (top pesticide intensity quartile) |
| Poor Nesting Habitat | Fires for corridor sites scoring below 25/100 on the NLCD-derived nesting suitability index |
| Shaded Habitat | Corridor sites with >55% tree canopy coverage within 150 m (WI DNR UTC 2022) |
Technical architecture
Bay Hive runs entirely in the browser as ES modules. No build step, no framework, no npm install required on the client side. A minimal Node.js static file server (serve.js) handles two server-side functions: CORS proxy for data sources that don't send cross-origin headers, and the NLCD tile processing pipeline.
The NLCD pipeline is the technically interesting part. To isolate individual land cover classes from the NLCD 2021 WMS, I wrote a pure Node.js PNG decoder — CRC32 verification, Paeth predictor for interlaced images, palette PNG support, RGBA encoder — with no npm dependencies. The same infrastructure powers both the per-class tile proxy (strips all non-matching pixels transparent, making it possible to isolate exactly one land cover type at a time) and the /api/nlcd-nesting endpoint (fetches NLCD tiles at zoom 13 and scores pixels within 300 m of a corridor site for nesting suitability). NLCD tile results are cached 24 hours server-side.
Everything else — map rendering (MapLibre GL JS 3.6.2), alerts computation, the IndexedDB caching layer, the timeline scrubber, the export engine — runs in the browser. No tracking, no analytics, no external JS beyond MapLibre. The app meets WCAG 2.2 AA: full keyboard navigation, roving tabindex, aria-live regions, and sufficient contrast throughout.
License
Bay Hive is released under the GNU General Public License v3.0 — free to use, modify, and distribute. Every piece of data comes from public sources. Every algorithm is straightforward spatial analysis. The only thing the project adds is the assembly: a single place where anyone working on pollinator habitat in the Green Bay area can see the full picture at once.